Railway and TRMNL just sound like they're meant to work together, right?
Railway is a deployment platform and TRMNL is a customizable e-ink dashboard display. Now my TRMNL displays the status of my Railway deployments.
TRMNL is great for keeping an eye on things without getting distracted. I wanted a quick way to know what was happening and if I needed to pay attention to any changes.
All code mentioned below is available on Github: railway-terminus and as a Railway template here.
My Dashboard
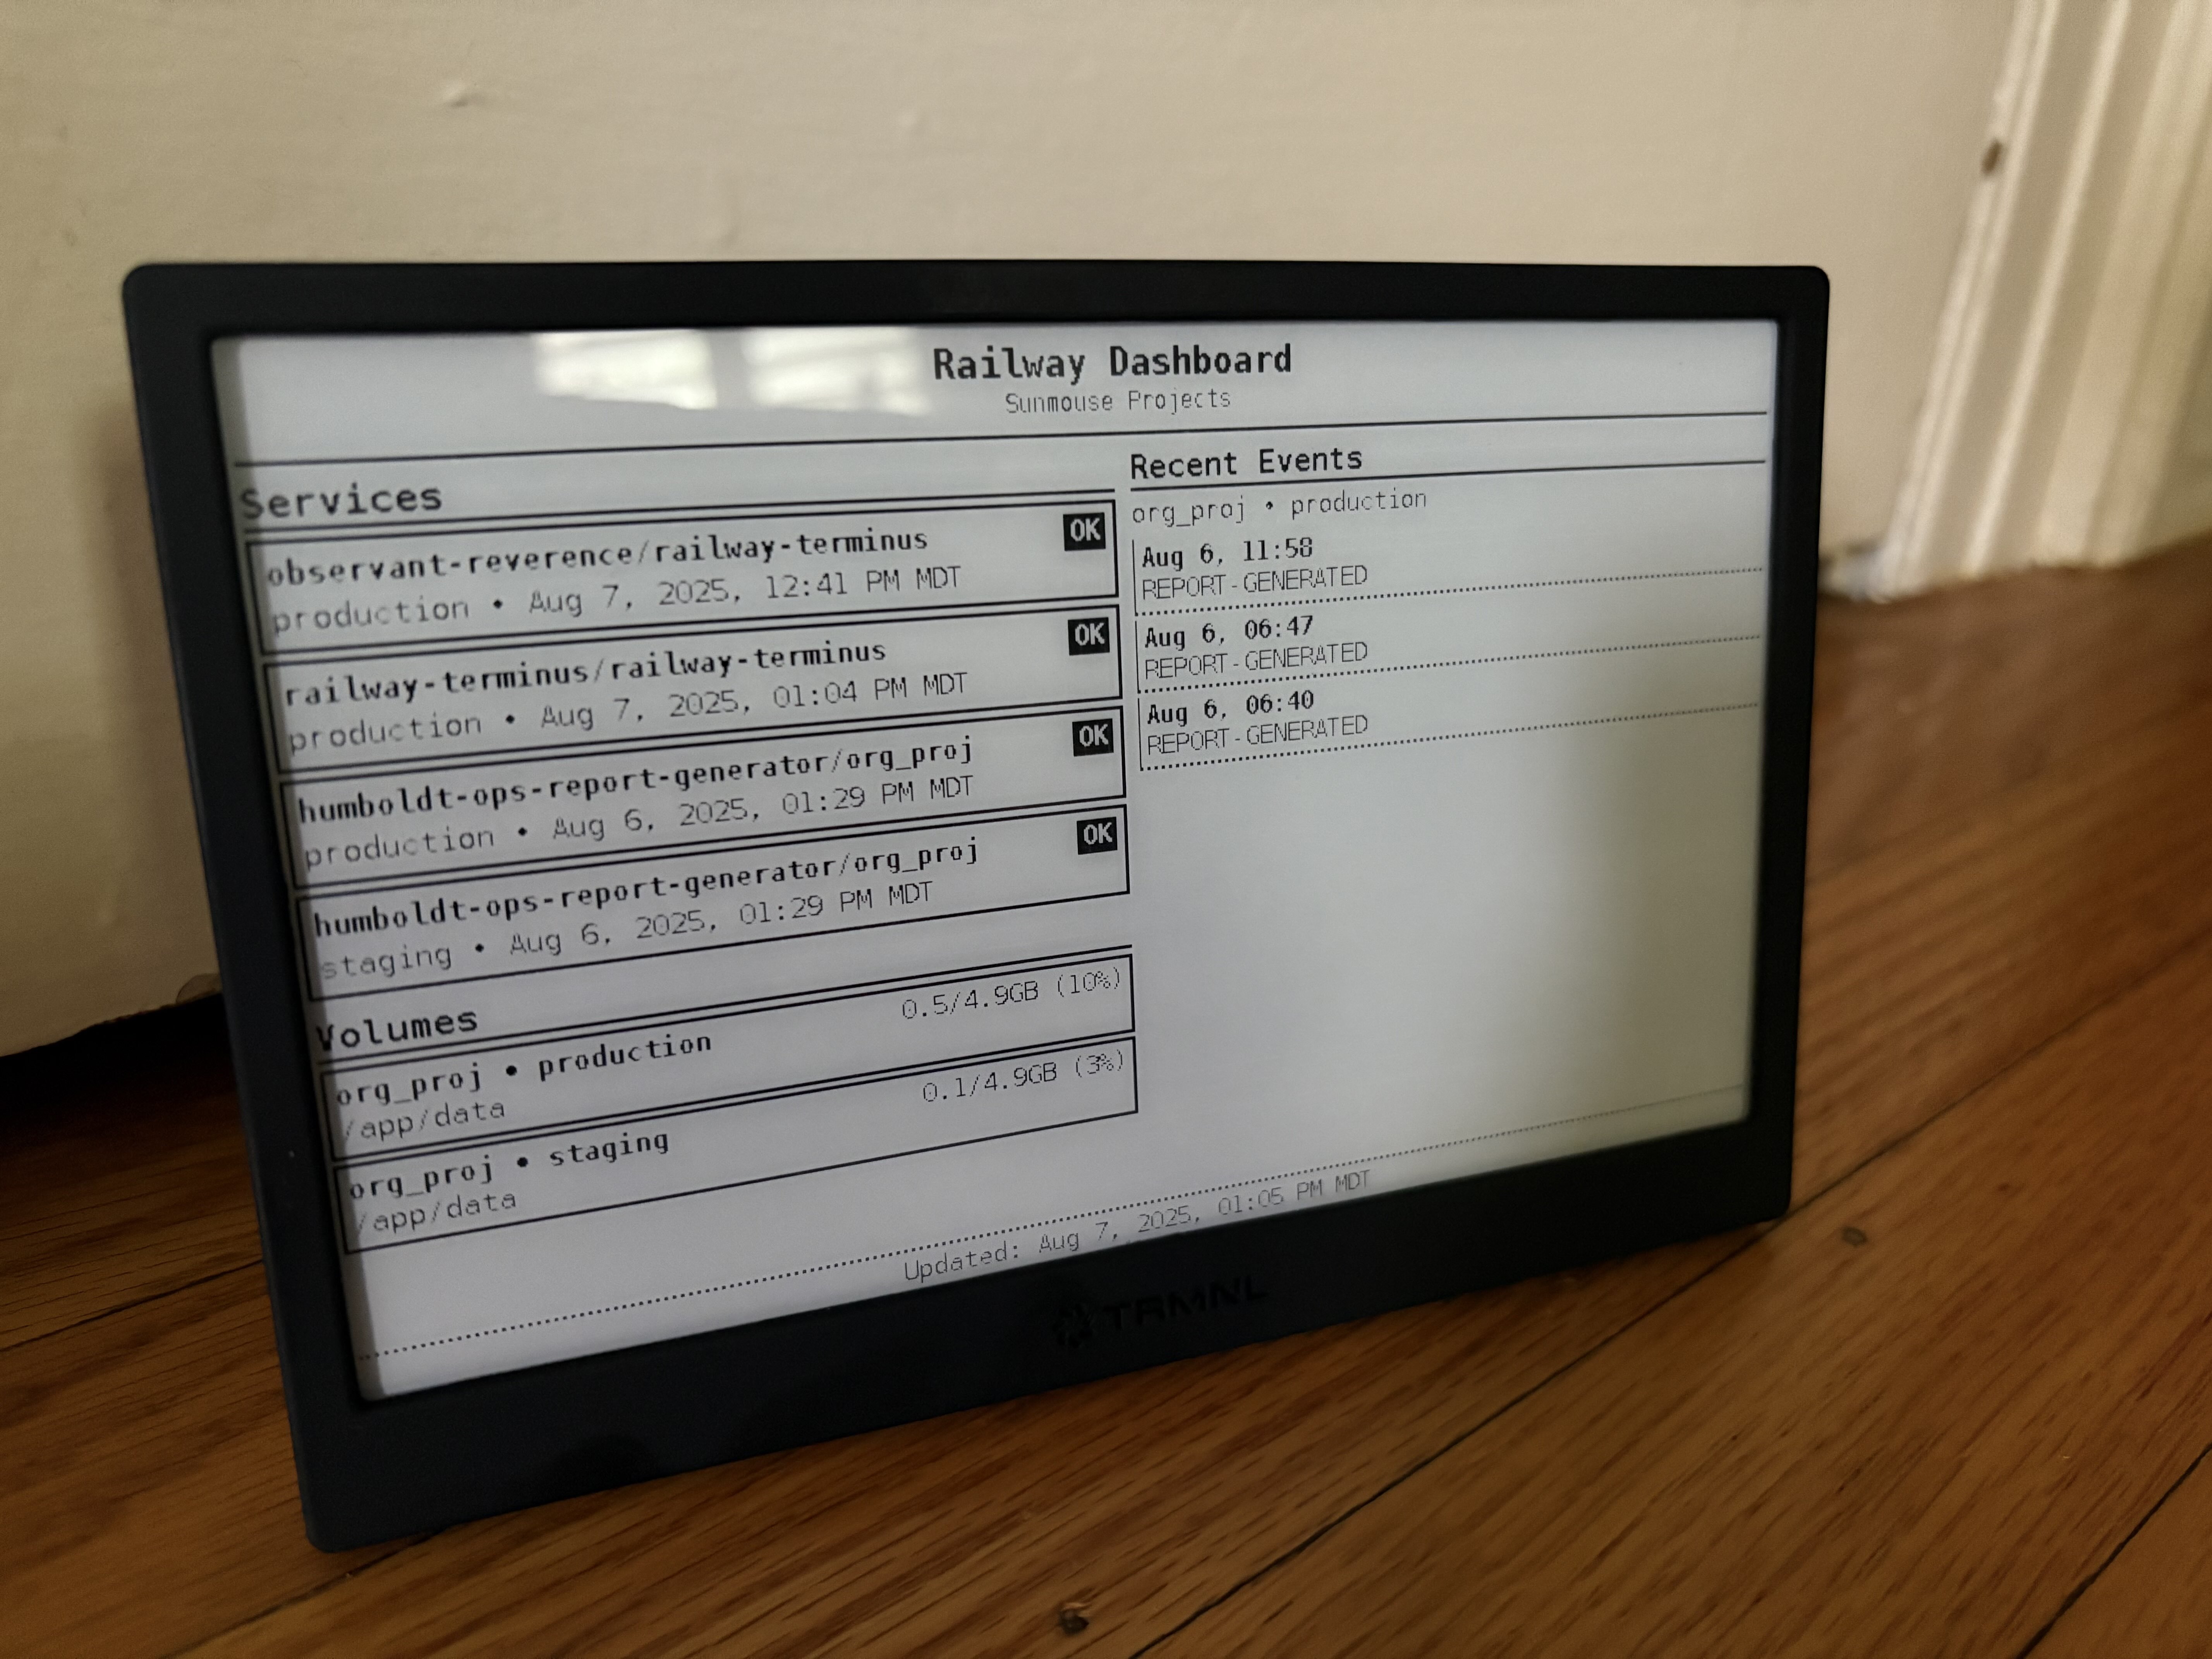
My specific requirements were that I wanted to see:
- all my deployed services (in any environment) and when they were last deployed
- how I was on storage space in all of my attached volumes
- For one of my projects, I use a specific log syntax to indicate user events and have a filter for that in my observability dashboard. I wanted those to show up on this dashboard as well.
Here's an example of what it looks like!
How it Works
Railway has a GraphQL API that, when called with a user token, can return a ton of information about the user’s projects, services, and deployments. According to the docs, this is the same API that powers the service’s dashboard, so it should be pretty complete.
TRMNL has the ability to create custom “plugins”, but I decided to take a slightly different, lighter-weight approach for this project. There’s a built-in plugin that takes a screenshot of a specified site, with the option to include specific headers. I decided to leverage that.
Initially, I did this without any “real” backend at all, by querying the Railway API and generating an HTML page as part of Github Actions pipeline, run on an hourly cron job, and then serving it via Github Pages. This worked well, but had a few disadvantages:
- the page was public, with no way to secure it
- The pipeline ran hourly, whether I needed the image or not (using unnecessary resources) and could already be fairly out of date when TRMNL took the screenshot.
- Any new config–filtering for a specific project, for instance–would require modifying or creating a new pipeline with different environment variables.
So I decided to go meta – hosting my Railway-monitoring code on Railway itself.
The code itself is ultra simple. A tiny server runs, with an endpoint that triggers it to run the graphql queries, process the data, and put it into an HTML template, which it returns to the user. TRMNL takes a screenshot of that HTML and it’s displayed on my device!
In reality, there are a handful of other pieces for either security or convenience.
Security
The user’s Railway API token–used to query the Railway API–is stored only serverside, as a environment variable in the user’s service.
To authenticate user requests to Terminus, a different token is created and saved as the env var TERMINUS_AUTH_TOKEN, and the user can only make a successful HTTP request if they provide the same token in a request header.
Filtering
While I have only a couple of services right now and they all fit on the display pretty well, I wanted the option to filter the display to just a single project or environment in the future and ideally to do this per-page request, so that I could have one TRMNL screen of stats for Project X and a different with Project Y.
Therefore, it supports headers X-Project-ID, X-Environment-ID, and X-Service-ID – all of which filter the queries to that specificity. Noted below, this only applies to Services and Volumes, not to logs, which are a bit of a different story.
Logs are a bit of a different case, because of the structure of the Railway API. There is not a single “Logs” entity – they’re grouped into EnvironmentLogs, which require an environment ID to be specified. For my particular use case, I wanted this to be handled differently than services and volumes. I wanted to see all of the services and volumes, but only the logs from the production service. So logs are specified separately, with a TERMINUS_LOGS_ENV_ID environment variable, or X-Logs-Environment-ID header.
Log Processing
To continue with logs, the log lines I cared about were formatted in a specific way: <EVENT> [REPORT GENERATED] details, details, details or <EVENT> [PROPERTY CREATED] details, details, details. I cared only about the name of the event – whatever was in square brackets – and didn’t want to display the extra details, both for the sake of space and for user privacy.
To that extent, there are two config details specified in the code. One is a filtering string (in this case <EVENT>) and the other is a regex or block of custom code that pulls out a subset of the line for display. I thought about making these env vars or headers as well, but decided against it for the sake of simplicity. Instead, they’re both specified in the code, in a config file that can be easily edited without modifying the rest of the codebase.
Deployment & Customization
Ready to deploy your own?

Fill in the environment variables. The only required variable is your Railway API token. You can get that following these directions. I have only tested this with an Account token, so I’m not sure whether a team or project token would work.
Optionally, you can specify a timezone and an environment ID for logs.
Then deploy your service. A build takes about 70 seconds the first time and half that on subsequent deploys.
Under the variables tab, copy the value of TERMINUS_AUTH_TOKEN. You’ll need to supply this as a header for all requests to the endpoint.
On the TRMNL side, create a new instance of the Screenshot plugin. Put the domain of your Railway service as the website, and for headers add:
Authorization=Bearer {{ your TERMINUS_AUTH_TOKEN goes here }}
If you want, you can also add–on the same line and joined with &:
X-Project-ID={{ your project id}}
Or another filter. As discussed above, the options are:
X-Project-ID, X-Environment-ID, X-Service-ID and X-Logs-Environment-ID
Save your plugin config. Then, on the right hand side, you can use “Force Refresh” to get a preview (if it doesn’t work or look how you expect, you can debug with the service logs), and set the refresh interval.
If you have not specified either X-Logs-Environment-ID or TERMINUS_LOGS_ENV_ID, no logs will display.
Customizing logs processing
As mentioned above, the logs are filtered on a specific syntax and then a regex is used to extract a specific portion of the line. This is modifiable in two ways:
- Fork my github repo, modify the logs config, and use it to deploy your own service.
- Link your CLI to your service deployed by template, use
railway sshand modify the file withvi src/config/event-logs.jsor your preferred editor.
Future additions
- Better support for teams, multiple workspaces, etc.– maybe with different endpoints?
- Show more extensive monitoring stats (CPU, memory, etc.) with little graphs and all
- TRMNL is soon to be supporting 2-bit graphics (four shades per pixel instead of 2!) and this means that the display can be made a little more informative by use of shading.
- More flexibility to specify log filtering and processing.
